Global water data
+ Follow new data149 datasets about water in Global.
The Lund-Potsdam-Jena Earth Observation SIMulator (LPJ-EOSIM) model estimates global wetland methane (CH4) emissions using simulated wetland extent and characteristics including soil moisture, temperature, and carbon content. For this dataset, wetlands are defined as land areas that are either permanently or seasonally saturated, excluding small ponds, lakes, and coastal wetlands. These wetland CH4 flux data will be used to support the United States Greenhouse Gas Center (GHGC) and its mission to study natural GHG fluxes. The model will also be used to facilitate improved rapid detection and attribution of climate-carbon feedback, and in strategic placement of measurement campaigns and monitoring systems as they relate to predicted biogeochemical hotspots. The LPJ-EOSIM L2 Global Simulated Monthly Wetland Methane Flux Low Latency (LPJ_EOSIM_L2_MCH4E_LL) Version 1 data product provides simulated monthly wetland CH4 flux globally at a spatial resolution of 0.5 degrees. The monthly simulation data contains aggregate versions of the daily LPJ-EOSIM L2 Global Simulated Daily Wetland Methane Flux Low Latency (LPJ_EOSIM_L2_DCH4E_LL) Version 1 data. The monthly data are presented in four Cloud Optimized GeoTIFF (COG) files: two based on the aggregated daily forcing datasets Modern-Era Retrospective analysis for Research and Applications Version 2 (MERRA-2) and European Centre for Medium-Range Weather Forecasts (ECMWF) Re-Analysis (ERA5), and two containing the mean and standard deviation values calculated from the monthly aggregate data. Due to the latency of global carbon dioxide (CO2) concentration estimates required for computation of LPJ-EOSIM simulated monthly CH4 flux data products, low latency (LPJ_EOSIM_L2_MCH4E_LL) and high latency (LPJ_EOSIM_L2_MCH4E) collections are available. Low latency data are delivered on a two-month cadence throughout the year. Granules will also be updated as new CO2 input data become available. Please refer to Section 2.0.1 of the User Guide for a more detailed explanation of estimated CO2 inputs and timing for scheduled updates to the collections.
The NOAA-20 Visible Infrared Imaging Radiometer Suite (VIIRS) Water Reservoir Monthly Level 3 (L3) Global (VJ128C3) Version 2 product provides current data for 151 man-made reservoirs and 13 regulated natural lakes for a total of 164 reservoirs. The VJ128C3 data product is a composite of the 8-day area classifications from VJ128C2 which is converted to provide monthly elevation and water storage. The Lake Temperature and Evaporation Model (LTEM) with input from VIIRS Land Surface Temperature and Emissivity (VJ121A2) and meteorological data from Global Land Data Assimilation System (GLDAS) are used to produce monthly evaporation rates and volume losses. The VJ128C3 data product provides a monthly time series that consists of a single variable with information about the reservoir identifier, dam location (longitude and latitude), reservoir surface area, elevation, water storage capacity, evaporation rate, and evaporation volume. Known Issues * Water occurrence images generally show smaller surface area dynamics in high latitude regions, creating pixels with low occurrence values that have relatively large uncertainties. In addition, the quality of raw water area classification can be affected by lake ice coverage typically creating an overestimation of surface area in the enhancement algorithm. This issue will be addressed in a future release of the enhancement algorithm. For additional information about known issues, refer to Section 4 in the User Guide.
The Aqua Moderate Resolution Imaging Spectroradiometer (MODIS) Water Reservoir Monthly Level 3 (L3) Global (MYD28C3) Version 6.1 product provides current data for 151 man-made reservoirs and 13 regulated natural lakes for a total of 164 reservoirs. The MYD28C3 Version 6.1 data product is a composite of the 8-day area classifications from MYD28C2, which is converted to provide monthly elevation and water storage. Lake Temperature and Evaporation Model (LTEM) via MODIS Land Surface Temperature (LST) (MYD21) and meteorological data from Global Land Data Assimilation System (GLDAS) are used to produce monthly evaporation rates and volume losses. The MYD28C3 data product contains a single layer with information about the reservoir identifier, dam location (longitude and latitude), monthly reservoir area, elevation, storage capacity, evaporation rate, and evaporation volume. Known Issues * Water occurrence images generally show smaller surface area dynamics in high latitude regions, creating pixels with low occurrence values that have relatively large uncertainties. In addition, the quality of raw water area classification can be affected by lake ice coverage typically creating an overestimation of surface area in the enhancement algorithm. This issue will be addressed in a future release of the enhancement algorithm. For additional information about known issues, refer to Section 4 in the User Guide and MODIS/VIIRS Land Quality Assessment website.
Renewable internal freshwater resources flows refer to internal renewable resources (internal river flows and groundwater from rainfall) in the country.
The NOAA-21 Visible Infrared Imaging Radiometer Suite (VIIRS) Water Reservoir Monthly Level 3 (L3) Global (VJ228C3) Version 2 product provides current data for 151 man-made reservoirs and 13 regulated natural lakes for a total of 164 reservoirs. The VJ228C3 data product is a composite of the 8-day area classifications from VJ228C2 which is converted to provide monthly elevation and water storage. The Lake Temperature and Evaporation Model (LTEM) with input from VIIRS Land Surface Temperature and Emissivity (VJ221A2) and meteorological data from Global Land Data Assimilation System (GLDAS) are used to produce monthly evaporation rates and volume losses. The VJ228C3 data product provides a monthly time series that consists of a single variable with information about the reservoir identifier, dam location (longitude and latitude), reservoir surface area, elevation, water storage capacity, evaporation rate, and evaporation volume. Known Issues * Water occurrence images generally show smaller surface area dynamics in high latitude regions, creating pixels with low occurrence values that have relatively large uncertainties. In addition, the quality of raw water area classification can be affected by lake ice coverage typically creating an overestimation of surface area in the enhancement algorithm. This issue will be addressed in a future release of the enhancement algorithm. For additional information about known issues, refer to Section 4 in the User Guide.
The Lund-Potsdam-Jena Earth Observation SIMulator (LPJ-EOSIM) model estimates global wetland methane (CH4) emissions using simulated wetland extent and characteristics including soil moisture, temperature, and carbon content. For this dataset, wetlands are defined as land areas that are either permanently or seasonally saturated, excluding small ponds, lakes, and coastal wetlands. These wetland CH4 flux data will be used to support the United States Greenhouse Gas Center (GHGC) and its mission to study natural GHG fluxes. The model will also be used to facilitate improved rapid detection and attribution of climate-carbon feedback and help with strategic placement of measurement campaigns and monitoring systems as they relate to predicted biogeochemical hotspots. The LPJ-EOSIM Level 2 Global Simulated Daily Wetland Methane Flux Low Latency (LPJ_EOSIM_L2_DCH4E_LL) Version 1 data product provides simulated daily wetland CH4 flux globally at a spatial resolution of 0.5 degrees. The daily data are presented in four Cloud Optimized GeoTIFF (COG) files: two based on the forcing datasets Modern-Era Retrospective analysis for Research and Applications Version 2 (MERRA-2) and European Centre for Medium-Range Weather Forecasts (ECMWF) Re-Analysis (ERA5), and two containing the mean and standard deviation values. Due to the latency of global carbon dioxide (CO2) concentration estimates required for computation of LPJ-EOSIM simulated daily CH4 flux data products, low latency (LPJ_EOSIM_L2_DCH4E_LL) and high latency (LPJ_EOSIM_L2_DCH4E) collections are available. Low latency data are delivered on a two-month cadence throughout the year. Granules will also be updated as new CO2 input data become available. Please refer to Section 2.0.1 of the User Guide for a more detailed explanation of CO2 estimate inputs and timing for scheduled updates to the collections.
The Lund-Potsdam-Jena Earth Observation SIMulator (LPJ-EOSIM) model estimates global wetland methane (CH4) emissions using simulated wetland extent and characteristics including soil moisture, temperature, and carbon content. For this dataset, wetlands are defined as land areas that are either permanently or seasonally saturated, excluding small ponds, lakes, and coastal wetlands. These wetland CH4 flux data will be used to support the United States Greenhouse Gas Center (GHGC) and its mission to study natural GHG fluxes. The model will also be used to facilitate improved rapid detection and attribution of climate-carbon feedback and in strategic placement of measurement campaigns and monitoring systems as they relate to predicted biogeochemical hotspots. The LPJ-EOSIM L2 Global Simulated Monthly Wetland Methane Flux (LPJ_EOSIM_L2_MCH4E) Version 1 data product provides simulated monthly wetland CH4 flux globally at a spatial resolution of 0.5 degrees. The monthly simulation data contains aggregate versions of the daily LPJ-EOSIM L2 Global Simulated Daily Wetland Methane Flux (LPJ_EOSIM_L2_DCH4E) Version 1 data. The monthly data are presented in four Cloud Optimized GeoTIFF (COG) files: two based on the aggregated daily forcing datasets Modern-Era Retrospective analysis for Research and Applications Version 2 (MERRA-2) and European Centre for Medium-Range Weather Forecasts (ECMWF) Re-Analysis (ERA5), and two containing the mean and standard deviation values calculated from the monthly aggregate data. Due to the latency of global carbon dioxide (CO2) concentration estimates required for computation of LPJ-EOSIM simulated monthly CH4 flux data products, low latency (LPJ_EOSIM_L2_MCH4E_LL) and high latency (LPJ_EOSIM_L2_MCH4E) collections are available. High latency data in this collection will be delivered around May of each year when National Oceanic and Atmospheric Administration’s (NOAA) Global Monitoring Laboratory (GML) publishes the previous year’s CO2 concentration and will have a lag of at least 5 months (January-May), and at most 17 months (January of the current year to May of the next year). Please refer to Section 2.0.1 of the User Guide for a more detailed explanation of estimated CO2 inputs and timing for scheduled updates to the collections.
The State of the World's Rivers is an interactive web database that illustrates data on ecological health in the world’s 50 major river basins. Indicators of ecosystem health are grouped into the categories of river fragmentation, biodiversity, and water quality. The database was created and published by International Rivers in 2014. The Dam Hotspots data contains over 5,000 dam locations determined by latitude and longitude coordinates. These locations were confined to the world’s 50 major river basins. The data set comes from multiple sources, and was corrected for location errors by International Rivers. The “project status”—a moving target—was determined by acquiring official government data, as well as through primary research from Berkeley and five International Rivers’ regional offices. * Operational: Already existing dams. * Under construction: Dams which are currently being constructed. * Planned: Dams whose studies or licensing have been completed, but construction has yet to begin. * Inventoried: Dams whose potential site has been selected, but neither studies nor licensing have occurred. * Suspended: Dams which have been temporarily or permanently suspended, deactivated, cancelled, or revoked. * Unknown: No data are currently available. Identifies dam locations for the world’s 50 major river basins
Date of Images: Post-Event: June 26, 2025 at 00:59 UTC (about 6:59PM MT) Pre-Event: June 20, 2025 Summary: We developed a rapid-response workflow to map flooded areas during this emergency event using multi-temporal Sentinel-1 SAR data. Sentinel-1’s SAR backscatter characteristics are particularly effective for detecting surface water: water surfaces typically exhibit low backscatter, whereas non-water areas show higher backscatter. Leveraging this physical property, we distinguished between water and non-water surfaces from both pre- and post-flood observations. To highlight flood-induced surface changes, we computed the differenced co-polarized VV backscatter (dVV = VV_post – VV_pre). This change detection technique enhances the visibility of newly inundated areas. We then applied a simple threshold to the dVV image to separate flooded from non-flooded areas. Suggested Use: The final output is a binary raster product, where pixels with a value of 1 represent flooded areas (dark blue color). Satellite/Sensor: Sentinel-1 /Synthetic Aperture Radar (SAR) Resolution: 10 meters Credits: Dr. Khuong H. Tran (Khuong.tran@nasa.gov) Service URL: WMS Endpoint:
Series EN_H2O_WBAMBQ: Proportion of bodies of water with good ambient water quality (%) Indicator 6.3.2: Proportion of bodies of water with good ambient water quality Target 6.3: By 2030, improve water quality by reducing pollution, eliminating dumping and minimizing release of hazardous chemicals and materials, halving the proportion of untreated wastewater and substantially increasing recycling and safe reuse globally Goal 6: Ensure availability and sustainable management of water and sanitation for all Release Version: 2018.Q2.G.01
Dates of Images: 4/30/2024, 5/7/2024, 5/12/2024 Date of Next Image: Varies by region, typically 12 days since previous pass. Summary: The Alaska Satellite Facility has developed surface water extent products of the Sentinel-1A/B Synthetic Aperture Radar (SAR) instrument. These images can be used to see where water is located at the time of the satellite overpass. This product shows all water detected and does not differentiate between normal water and flood water. To determine where flooding may have occurred, combine this layer with a reference water layer. The water extent difference maps shown here were created by subtracting the water extent of the first date from the water extent of the second date to show what changes, if any, occurred in the water extent. Suggested Use: Water extent difference: Light Blue: Water Present in the Second Date Only Dark Blue: Water Present in Both Dates Orange: Water Present in the First Date Only Satellite/Sensor: Synthetic Aperture Radar on European Space Agency's (ESA) Copernicus Sentinel-1A satellite Resolution: 30 meters Service URL: WMS Endpoint:
Dates of Images: Post-Event: Pre-Event: April 5, 2026 Date of Next Image: None Summary: The Modified Normalized Difference Water Index (mNDWI) provides a different view of the Earth's surface combining different bands to make water bodies more obvious. This index can be used to identify flooded areas as well as heavily saturated areas. Suggested Use: For mNDWI, areas of existing water, such as a rivers or lakes appear in the darkest green with high values near 1, while dry land appears in the darkest brown with low values near -1. This product can be used to identify potentially flooded areas that can be seen in varying shades of green and light brown depending on the amount of moisture picked up by the satellite. Note: Areas of cloud cover will show up in varying shades of green/blue similar to water. Satellite/Sensor: Landsat 9 Operational Land Imager (OLI), Landsat 8 Resolution: 30 meters Credits: NASA/MSFC, USGS Esri REST Endpoint: See URL to the right. WMS: https://gis.earthdata.nasa.gov/portal/services/DISASTERS_202604_TYPHON_SINLAKU/202606_landsat_mndwi/ImageServer/WMSServer
Dates of Images: May 5, 2022 Date of Next Image: None Summary: Normalized Difference Water Index (NDWI) provides a different view of the Earth's surface combining different bands to make water bodies more obvious. This index can be used to identify flooded areas as well as heavily saturated areas. Suggested Use: For NDWI, areas of existing water, such as a rivers or lakes appear in the darkest green with high values near 1, while dry land appears in the darkest brown with low values near -1. This product can be used to identify potentially flooded areas that can be seen in varying shades of green and light brown depending on the amount of moisture picked up by the satellite. Note: Areas of cloud cover will show up in varying shades of green/blue similar to water. Satellite/Sensor: MultiSpectral Instrument (MSI) on European Space Agency's (ESA) Copernicus Sentinel-2A/2B satellites Resolution: 10 meters Credits: NASA/MSFC, USGS, ESA Copernicus Esri REST Endpoint: See URL to the right. WMS: https://gis.earthdata.nasa.gov/portal/services/DISASTERS_EX2601_201809_HURRICANE_FLORENCE/ex2601_sentinel2_ndwi/ImageServer/WMSServer
Dates of Images: Pre-Event: 11/4/2024, 11/6/2024, 11/11/2024 Post-Event: 11/16/2024, 11/18/2024, 11/23/2024 Date of Next Image: Varies by region, typically 12 days since previous pass. Set time slider to most recent interval and click on area of interest to identify date of last pass. Summary: The Alaska Satellite Facility has developed false color Red, Green, Blue (RGB) and Radiometrically Terrain-Correct (RTC) composites and surface water extent products of the Sentinel-1A/B Synthetic Aperture Radar (SAR) instrument which assigns the co- and cross-polarization information to a channel in the composite. When used to support a flooding event, areas in blue denotes water present at the time of the satellite overpass before or after the start of the flooding event. Sentinel-1 RGB Decomposition of RTC VV and VH imagery over United States coastlines. Blue areas have low returns in VV and VH (smooth surfaces such as calm water, but also frozen/crusted soil or dry sand), Green areas have high returns in VH (volume scatterers such as vegetation or some types of snow/ice), and Red areas have relatively high VV returns and relatively low VH returns (such as urban or sparsely vegetated areas). Suggested Use: In the RGB images, water appears in blue, vegetated areas in shades of green and urban areas in bright orange. It is recommended to use this product with ancillary information to derive flooded areas. In the Water Extent images, data is classified from the above imagery shows water, including flooded areas, as blue. Satellite/Sensor: Synthetic Aperture Radar on European Space Agency's (ESA) Copernicus Sentinel-1A satellite Resolution: 20 meters
Dates of Images: Post-Event: 5/8/2024; 5/15/2024 Pre-Event: 4/6/2024; 4/21/2024 Summary: mNDWI: The Modified Normalized Difference Water Index (mNDWI) provides a different view of the Earth's surface combining different bands to make water bodies more obvious. This index can be used to identify flooded areas as well as heavily saturated areas. Suggested Use: mNDWI: Areas of existing water, such as a rivers or lakes appear in the darkest green with high values near 1, while dry land appears in the darkest brown with low values near -1. This product can be used to identify potentially flooded areas that can be seen in varying shades of green and light brown depending on the amount of moisture picked up by the satellite. Note: Areas of cloud cover will show up in varying shades of green/blue similar to water. Satellite/Sensor: Landsat 9 Operational Land Imager (OLI) Resolution: 30 meters Credits: NASA/MSFC, USGS Esri REST Endpoint: See URL section on right side of page WMS Endpoint: https://gis.earthdata.nasa.gov/portal/services/DISASTERS_EX2601_201809_HURRICANE_FLORENCE/ex2601_landsat_ndvi/ImageServer/WMSServer
Dates of Images: Post-Event: 5/24/2022 Pre-Event: 5/16/2022 Summary: mNDWI: The Modified Normalized Difference Water Index (mNDWI) provides a different view of the Earth's surface combining different bands to make water bodies more obvious. This index can be used to identify flooded areas as well as heavily saturated areas. Suggested Use: mNDWI: Areas of existing water, such as a rivers or lakes appear in the darkest green with high values near 1, while dry land appears in the darkest brown with low values near -1. This product can be used to identify potentially flooded areas that can be seen in varying shades of green and light brown depending on the amount of moisture picked up by the satellite. Note: Areas of cloud cover will show up in varying shades of green/blue similar to water. Satellite/Sensor: Landsat 9 Operational Land Imager (OLI) Resolution: 30 meters Credits: NASA/MSFC, USGS Esri REST Endpoint: See URL section on right side of page WMS Endpoint: https://gis.earthdata.nasa.gov/portal/services/DISASTERS_EX2603_202205_FLOOD_MN/ex2603_landsat_mndwi/ImageServer/WMSServer
Dates of Images: Pre-Event: 10/3/2024, 10/8/2024 Post-Event: 10/11/2024, 10/20/2024 Date of Next Image: Varies by region, typically 12 days since previous pass. Set time slider to most recent interval and click on area of interest to identify date of last pass. Summary: The Alaska Satellite Facility has developed false color Red, Green, Blue (RGB) and Radiometrically Terrain-Correct (RTC) composites and surface water extent products of the Sentinel-1A/B Synthetic Aperture Radar (SAR) instrument which assigns the co- and cross-polarization information to a channel in the composite. When used to support a flooding event, areas in blue denotes water present at the time of the satellite overpass before or after the start of the flooding event. Sentinel-1 RGB Decomposition of RTC VV and VH imagery over United States coastlines. Blue areas have low returns in VV and VH (smooth surfaces such as calm water, but also frozen/crusted soil or dry sand), Green areas have high returns in VH (volume scatterers such as vegetation or some types of snow/ice), and Red areas have relatively high VV returns and relatively low VH returns (such as urban or sparsely vegetated areas). Suggested Use: In this image, water appears in blue, vegetated areas in shades of green and urban areas in bright orange. It is recommended to use this product with ancillary information to derive flooded areas. Post-event data is classified from the above imagery shows water that is detected by the sensor with different colors indicating different land cover/land use classifications from CDL that appear to have water and are potentially flooded. Blue (1): Known Water Red (2): Flooded Developed Green (3): Flooded Vegetation Orange (4): Flooded Cropland/Grassland Satellite/Sensor: Synthetic Aperture Radar on European Space Agency's (ESA) Copernicus Sentinel-1A satellite Resolution: 20 meters Esri REST Endpoint:
Background: MODIS Flood 1 Day Observations is a collection of GeoTiffs representing 1D1OS WMP : 1 Day imagery, 1 Observations required, Terrain & Cloud Shadow Masking. NASA Goddard's Hydrology Laboratory is working to operationalize near real-time global flood mapping using available satellite data resources -- currently the twice daily overpass of the MODIS instrument, on the Terra and Aqua satellites. We are working to include additional data sources, such as Landsat and radar, to improve coverage and accuracy. This work builds on the long-time expertise and efforts of the Dartmouth Flood Observatory (DFO) to map floodwater extent in detail for active floods. The DFO website provides additional detail, additional products, and archives of historical flood maps. This NASA website provides links and information about the automated daily flood and surface water products produced at NASA Goddard. Data Visualization: MODIS Flood layer is represented using Unique Values Ranging from 0-3. 0 : Insufficient data to make water determination (cloudy, missing images, swath gaps, or bad data values). 1 : No water detected. 2 : Water detected AND coinciding with reference water (e.g., not flood). 3 : Water detected, beyond reference water, so may be flood. Daily Suggested Usage: Flood detection and showing areas of surface water inundation. Further Reference: Learn more about MODIS Flood Products Purpose/Summary: Flood Detection Map, MODIS Flood 1 Day (1D1OS), Updated Daily
This vector tile layer presents the Environment Surface Water and Label style (World Edition) and provides a global reference of surface water features and their respective labels. This layer is designed for use with the Environment Base, Environment Detail and Label, and Environment Watersheds to combine into one unified basemap. This vector tile layer provides unique capabilities for customization and high-resolution display. This vector tile layer is built using the same data sources used for other Esri Vector Basemaps. For details on data sources contributed by the GIS community, view the map of Community Maps Basemap Contributors. Esri Vector Basemaps are updated monthly. This layer is used in the Environment Map web map included in ArcGIS Living Atlas of the World. See the Vector Basemaps group for other vector tile layers. Customize this Style Learn more about customizing this vector basemap style using the Vector Tile Style Editor. Additional details are available in ArcGIS Online Blogs and the Esri Vector Basemaps Reference Document.
Rivers, streams, canals and drains from OpenStreetMap (ways tagged waterway), with names where mapped.
The Terra Moderate Resolution Imaging Spectroradiometer (MODIS) Water Reservoir Monthly Level 3 (L3) Global (MOD28C3) Version 6.1 product provides current data for 151 man-made reservoirs and 13 regulated natural lakes for a total of 164 reservoirs. The MOD28C3 Version 6.1 data product is a composite of the 8-day area classifications from MOD28C2, which is converted to provide monthly elevation and water storage. Lake Temperature and Evaporation Model (LTEM) via MODIS Land Surface Temperature (LST) (MOD21) and meteorological data from Global Land Data Assimilation System (GLDAS) are used to produce monthly evaporation rates and volume losses. The MOD28C3 data product contains a single layer with information about the reservoir identifier, dam location (longitude and latitude), monthly reservoir area, elevation, storage capacity, evaporation rate, and evaporation volume. Known Issues * Water occurrence images generally show smaller surface area dynamics in high latitude regions, creating pixels with low occurrence values that have relatively large uncertainties. In addition, the quality of raw water area classification can be affected by lake ice coverage typically creating an overestimation of surface area in the enhancement algorithm. This issue will be addressed in a future release of the enhancement algorithm. For additional information about known issues, refer to Section 4 in the User Guide and MODIS/VIIRS Land Quality Assessment website.
The Lund-Potsdam-Jena Earth Observation SIMulator (LPJ-EOSIM) model estimates global wetland methane (CH4) emissions using simulated wetland extent and characteristics including soil moisture, temperature, and carbon content. For this dataset, wetlands are defined as land areas that are either permanently or seasonally saturated, excluding small ponds, lakes, and coastal wetlands. These wetland CH4 flux data will be used to support the United States Greenhouse Gas Center (GHGC) and its mission to study natural GHG fluxes. The model will also be used to facilitate improved rapid detection and attribution of climate-carbon feedback and help with strategic placement of measurement campaigns and monitoring systems as they relate to predicted biogeochemical hotspots. The LPJ-EOSIM Level 2 Global Simulated Daily Wetland Methane Flux (LPJ_EOSIM_L2_DCH4E) Version 1 data product provides simulated daily wetland CH4 flux globally at a spatial resolution of 0.5 degrees. The daily data are presented in four Cloud Optimized GeoTIFF (COG) files: two based on the forcing datasets Modern-Era Retrospective analysis for Research and Applications Version 2 (MERRA-2) and European Centre for Medium-Range Weather Forecasts (ECMWF) Re-Analysis (ERA5), and two containing the mean and standard deviation values. Due to the latency of global carbon dioxide (CO2) concentration estimates required for computation of LPJ-EOSIM simulated daily CH4 flux data products, low latency (LPJ_EOSIM_L2_DCH4E_LL) and high latency (LPJ_EOSIM_L2_DCH4E) collections are available. High latency data in this collection will be delivered around May of each year when National Oceanic and Atmospheric Administration’s (NOAA) Global Monitoring Laboratory (GML) publishes the previous year’s CO2 concentration and will have a lag of at least 5 months (January-May), and at most 17 months (January of the current year to May of the next year). Please refer to Section 2.0.1 of the User Guide for a more detailed explanation of CO2 estimate inputs and timing for scheduled updates to the collections.
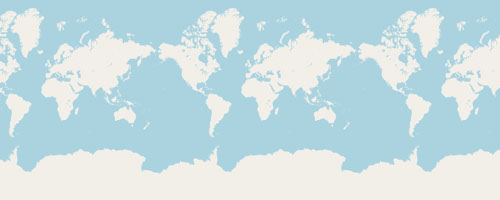
Renewable internal freshwater resources flows refer to internal renewable resources (internal river flows and groundwater from rainfall) in the country. Renewable internal freshwater resources per capita are calculated using the World Bank's population estimates.
Annual freshwater withdrawals refer to total water withdrawals, not counting evaporation losses from storage basins. Withdrawals also include water from desalination plants in countries where they are a significant source. Withdrawals can exceed 100 percent of total renewable resources where extraction from nonrenewable aquifers or desalination plants is considerable or where there is significant water reuse. Withdrawals for agriculture and industry are total withdrawals for irrigation and livestock production and for direct industrial use (including withdrawals for cooling thermoelectric plants). Withdrawals for domestic uses include drinking water, municipal use or supply, and use for public services, commercial establishments, and homes.
Annual freshwater withdrawals refer to total water withdrawals, not counting evaporation losses from storage basins. Withdrawals also include water from desalination plants in countries where they are a significant source. Withdrawals can exceed 100 percent of total renewable resources where extraction from nonrenewable aquifers or desalination plants is considerable or where there is significant water reuse. Withdrawals for domestic uses include drinking water, municipal use or supply, and use for public services, commercial establishments, and homes. Data are for the most recent year available for 1987-2002.
Annual freshwater withdrawals refer to total water withdrawals, not counting evaporation losses from storage basins. Withdrawals also include water from desalination plants in countries where they are a significant source. Withdrawals can exceed 100 percent of total renewable resources where extraction from nonrenewable aquifers or desalination plants is considerable or where there is significant water reuse. Withdrawals for industry are total withdrawals for direct industrial use (including withdrawals for cooling thermoelectric plants). Data are for the most recent year available for 1987-2002.
The Aqua Moderate Resolution Imaging Spectroradiometer (MODIS) Water Reservoir 8-Day Level 3 (L3) Global (MYD28C2) Version 6.1 product provides current data for 151 man-made reservoirs and 13 regulated natural lakes for a total of 164 reservoirs. The MYD28C2 Version 6.1 data product provides an 8-day time series of surface area, elevation, and water storage. Datasets are combined with pre-established Area-Elevation (A-E) curves and image classifications of near-infrared (NIR) reflectance from the surface reflectance product acquired by the Aqua satellite (MYD09Q1). The MYD28C2 data product contains a single layer with information about the reservoir identifier, dam location (longitude and latitude), reservoir area, elevation, and storage capacity. Known Issues * Water occurrence images generally show smaller surface area dynamics in high latitude regions, creating pixels with low occurrence values that have relatively large uncertainties. In addition, the quality of raw water area classification can be affected by lake ice coverage typically creating an overestimation of surface area in the enhancement algorithm. This issue will be addressed in a future release of the enhancement algorithm. For additional information about known issues, refer to Section 4 in the User Guide and MODIS/VIIRS Land Quality Assessment website.
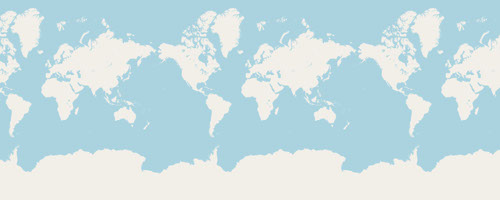
A polygon representing the Kapuas site, published by Orion Terrametrics.
The level of water stress: freshwater withdrawal as a proportion of available freshwater resources is the ratio between total freshwater withdrawn by all major sectors and total renewable freshwater resources, after taking into account environmental water requirements. Main sectors, as defined by ISIC standards, include agriculture; forestry and fishing; manufacturing; electricity industry; and services. This indicator is also known as water withdrawal intensity.