OrionInsights
Build it, share it, ask it — live reporting on catalogue data, not on last month's export.
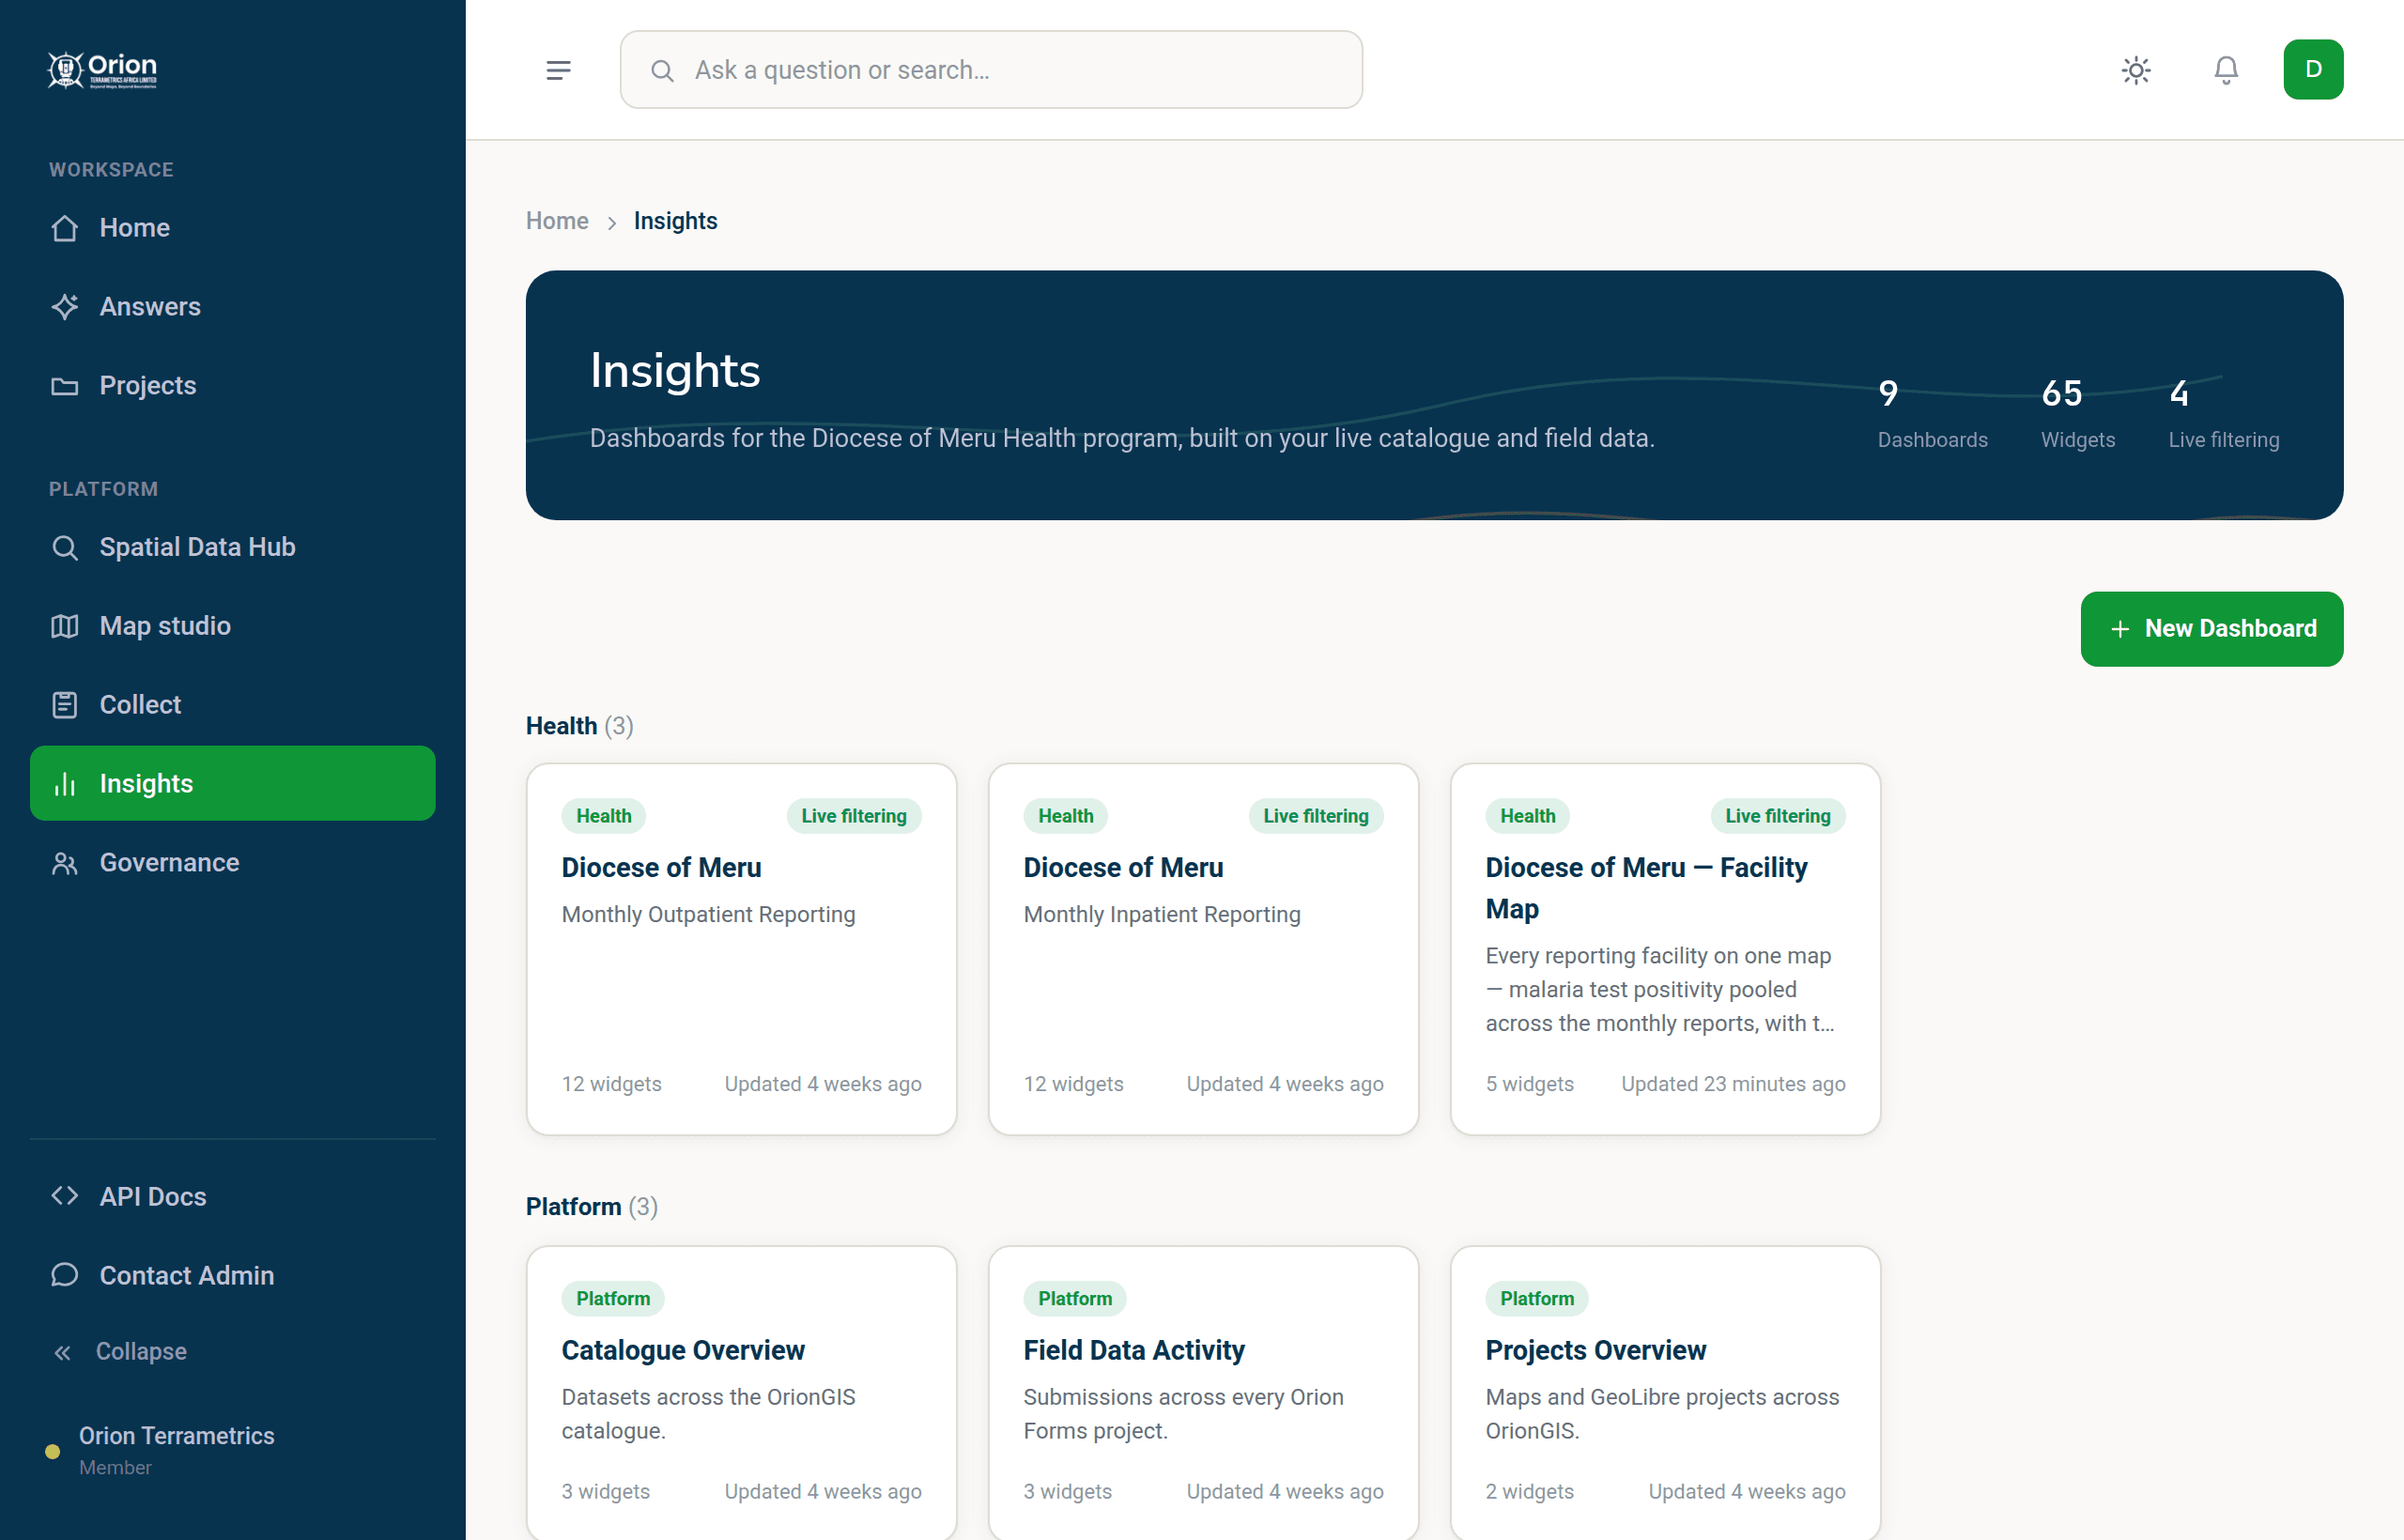
From catalogue to dashboard in minutes.
Dashboards read the catalogue directly, so the numbers move when the data does.
Put a question to a dashboard in plain language and it answers with charts.
Share reporting with people who will never open a GIS — with access you control.
Reporting that stays current without a refresh pipeline.
Chart, map and indicator widgets assembled from the same governed layers everything else runs on — one set of numbers, one source.
Ask a question in plain language and the assistant answers with charts built from that dashboard's own data — no query to write.
Reporting that stops being an assembly job.
Sub-county teams file monthly returns that reach the county as a spreadsheet to be assembled by hand, so review happens weeks after the month it describes. On OrionInsights those returns are the dashboard — it reads the catalogue directly, facility-level filters take the team down to a single facility, and a question asked in plain language comes back as charts during the review meeting.

A diocesan secretariat collects monthly returns from its health facilities and termly reports from its schools, then consolidates them by hand before anyone can see the whole network. Both departments collect in OrionForms, so OrionInsights builds one live dashboard on the same catalogue the submissions land in — shared with the diocesan health coordinator and education office, with access the secretariat controls.

A provider tracking coverage, hours of supply and non-revenue water compiles quarterly figures out of several spreadsheets before anyone can read them. With its performance and asset data in the catalogue, the dashboard moves as the data updates and the team shares it with the board and the county — no export to rebuild, no stale copy in circulation.
Questions, answered.
What is OrionInsights?
The dashboards and reporting layer of OrionGIS: live views built directly on catalogue data, with a Q&A assistant that answers questions with charts from that dashboard's own data.
How is this different from exporting into a BI tool?
An export starts going stale the moment it is created, and someone owns refreshing it forever. OrionInsights reads the catalogue directly, so the dashboard reflects the current data without a pipeline.
Which plans include OrionInsights?
Growth and above. The Free plan includes the platform itself — maps, spatial analysis and the curated catalogue — with AI answers capped at 10 questions a month.
Ready to stop rebuilding the same report?
Build a dashboard on catalogue data in minutes, share it with the people who need it, and let them ask it their own questions.