Spatial Analytics
Buffer it, overlay it, measure it — the analysis behind site selection, catchments and service areas, without writing a line of code.
Analysis without the specialist bottleneck.
Buffer, overlay, proximity and zonal statistics through the interface — no desktop licence, no script to maintain.
Every analysis runs against catalogue layers with provenance attached, so results trace back to their inputs.
Results come back as maps and layers you can style, publish and embed — not as a folder of files.
The questions most spatial work actually starts with.
Distance, intersection and containment across any layers in the catalogue — the operations behind site selection, catchments and service areas.
Summarise population, land cover or any attribute inside a boundary — wards, catchments, project areas — and read the numbers back on the map.
From a hunch to a defensible number.
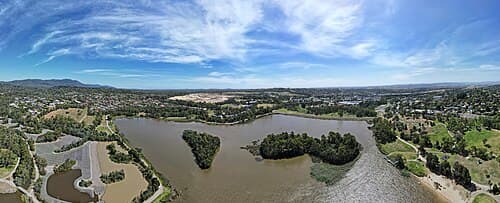
Dry or low-yield boreholes are usually a siting problem, not a drilling one — so a county WASH team layers geology, land cover and population against its own water-point records, then buffers the settlements with no working point within reach. The analysis runs in the interface against governed layers without a line of code, and the shortlist comes out as a map with its inputs attached — ready for the hydrogeologist to take into the field.
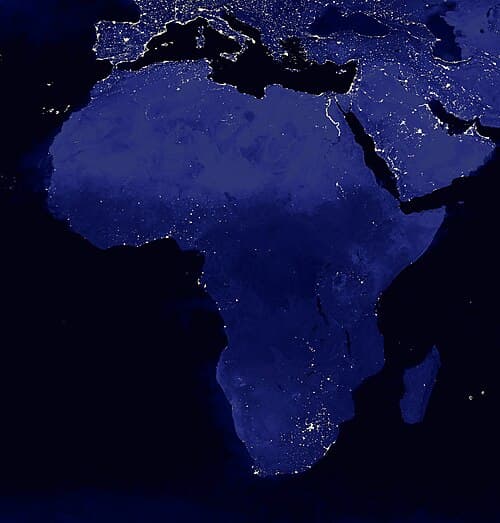
A county health management team holds a geocoded facility list and a population grid but no picture of what they mean together, so it draws service areas around every facility and reads the population back with zonal statistics. The output is a map and a list of the settlements left outside those service areas — the same method and the same inputs every time the question is asked.
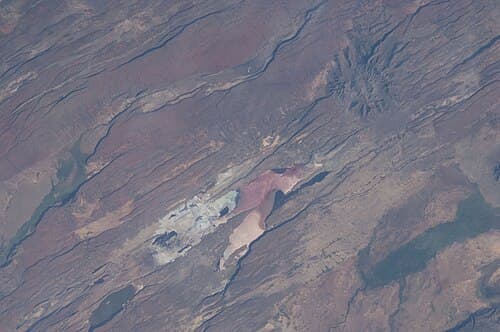
Kenya's planning standard is a 24-minute walk to the nearest public primary school, and a county education office needs to see which sub-locations still miss it — so it draws catchments around every school and summarises the population inside each one. The gaps come back ranked for the next infrastructure round, and the same analysis can be re-run when the next school opens.
Questions, answered.
What is Spatial Analytics?
The analysis surface of OrionGIS: buffer, overlay, proximity and zonal statistics run against catalogue layers in the browser, with every result returned as a mappable, exportable layer.
Do we need to know Python or SQL?
No. The operations run through the interface, and you can describe what you want in plain language — the AI assembles the analysis and it is verified before it publishes.
Can the same analysis be reproduced later?
Yes. Analyses run against versioned catalogue layers with provenance attached, so the same question asked in six months returns the same inputs and the same method.
Ready to answer it with data?
Ask your first spatial question and see the analysis assembled against governed data — verified, mapped and ready to share.