← All sectors
OrionGIS for Insurance & Finance
Insurance & Finance
Underwrite with the full picture on the map.
Ask OrionAI
One request. A finished, explained map.
“Show slope and hillshade around Mount Fuji”
The map shows Mount Fuji's terrain in two layers: a grey hillshade that gives the relief its 3-D look, and a slope map laid over it at 72% opacity so both read together. Slopes run from flat to 65.5°; about a quarter of the area is nearly flat (0–5°), while the steepest ground (35–45° and above) covers roughly 8.5% and sits on the volcano's flanks and gullies.
Data: Orion Terrametrics · OpenStreetMap contributors · recorded in OrionGIS, Mount Fuji, Japan
How OrionAI works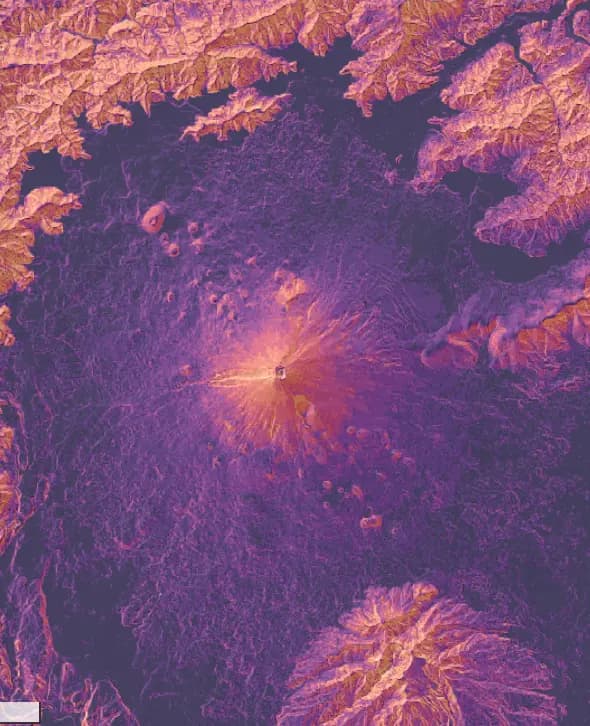 Mount Fuji, Japan
What OrionGIS does for insurance & finance
Ready to run on your data now.
- Exposure, hazard and asset datasets searchable and layered together today
- View policies and portfolios against flood, climate or infrastructure risk layers
- Run claims and risk surveys with OrionForms — web and mobile, offline-capable
- Self-hosted, so actuarial and policyholder data stays under the insurer's control
Coming next: Next, we're building exposure aggregation and per-policy risk scoring.
Working in insurance & finance? Let's talk about what you need mapped.
Other sectors